Let’s talk about your project.
“In 30 minutes we clarify what you want to achieve and which of your devices we will connect. You speak directly with me.”
Act
You put together a dedicated view for each role, with the key figures that matter for its decisions.
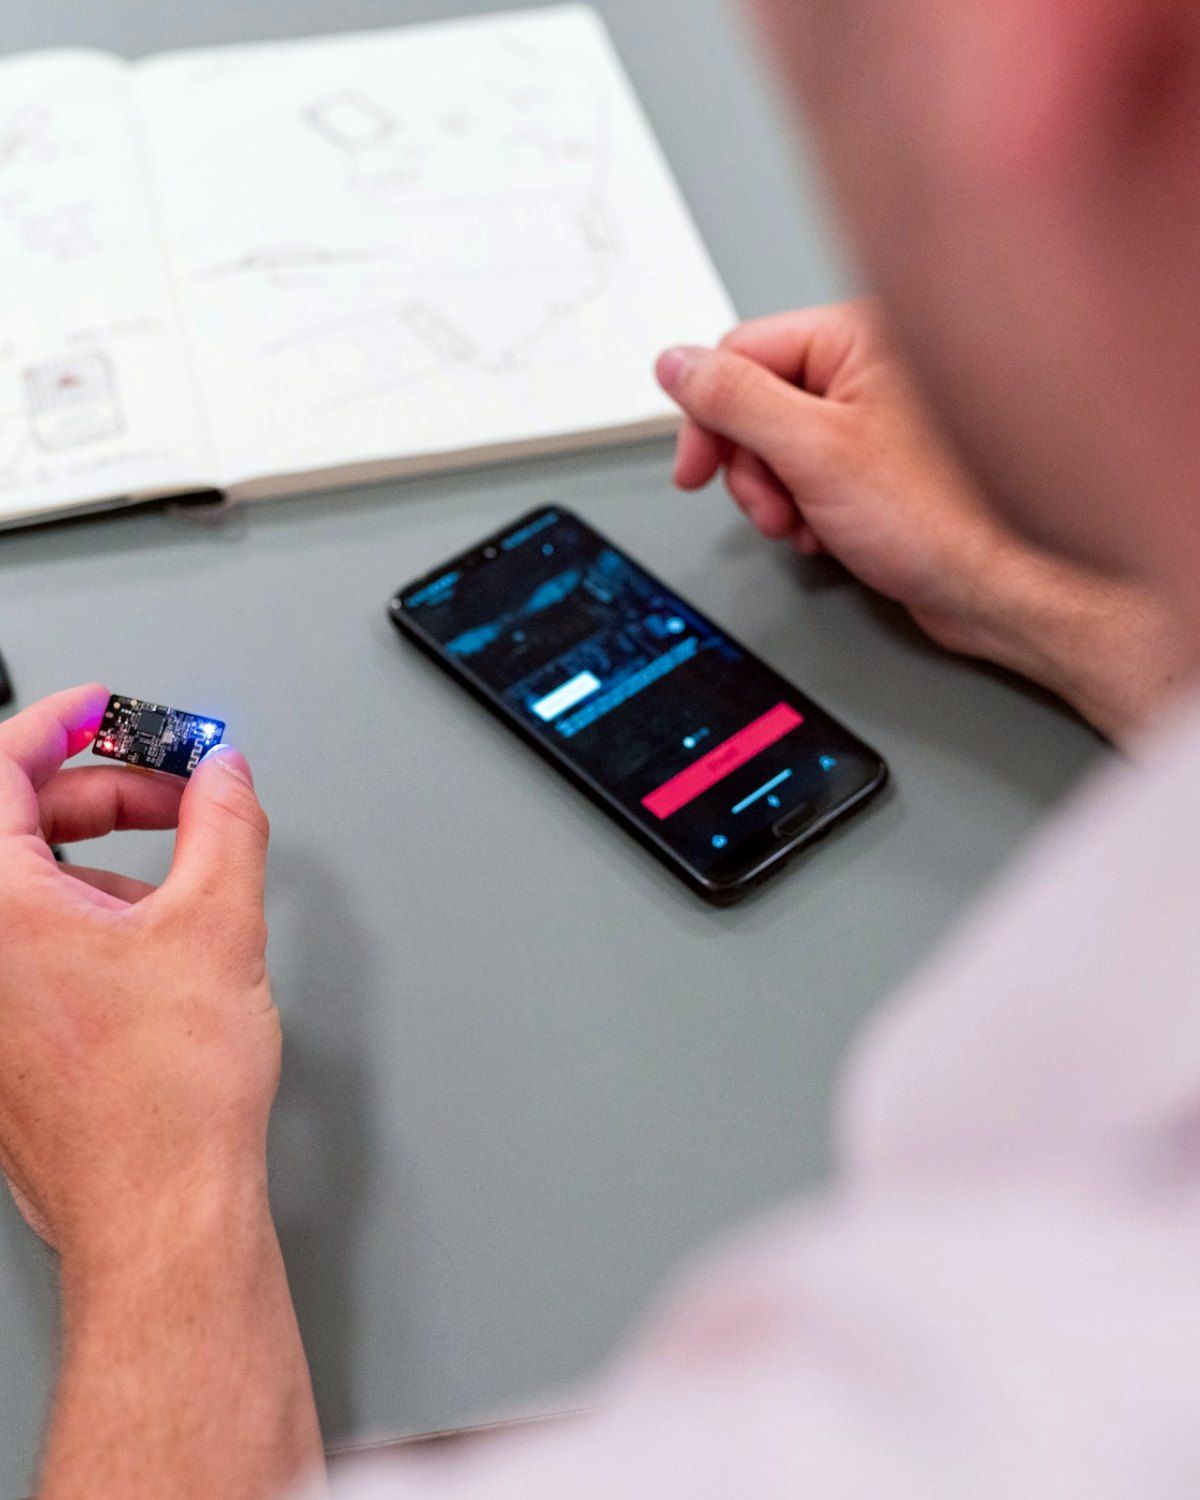
Therapy, training and management need different perspectives on the same data. With the Dashboard Generator you select key figures, trends, comparisons and groups from the data and arrange them into a view tailored to a role. The finished dashboard is available to the relevant user group directly in the Health & Performance Workplace – without detours via external tools.
| Environment | Part of the Health & Performance Workplace |
|---|---|
| Elements | Key figures, trends, comparisons, groups |
| Visualisations | Trend charts, scores, radar charts, zone bars, tables, traffic-light status |
| Focus | Role- and group-specific views |
Datico® Life Patient Datico® Life Athlete Datico® Life Responder Datico® Life Participant

“In 30 minutes we clarify what you want to achieve and which of your devices we will connect. You speak directly with me.”
Session cookies for basic website functions. Cannot be disabled.
Google Analytics 4 for pseudonymised analysis of website usage, delivered via Google Tag Manager.
Identification of the visiting company based on its IP address (Leadfeeder); when you submit a form, Leadfeeder links the visit history to your contact details. Also conversion tracking.
YouTube videos (privacy-enhanced mode), booking calendar (Zoho Bookings), LinkedIn content.